Evaluation of gait asymmetry based on data from a depth sensor
Engineer's thesis, 2023
Author: Sofiya Makarenka
Supervisor: Jakub Wagner
First place in the Engineer 4 Science 2023 contest
Abstract
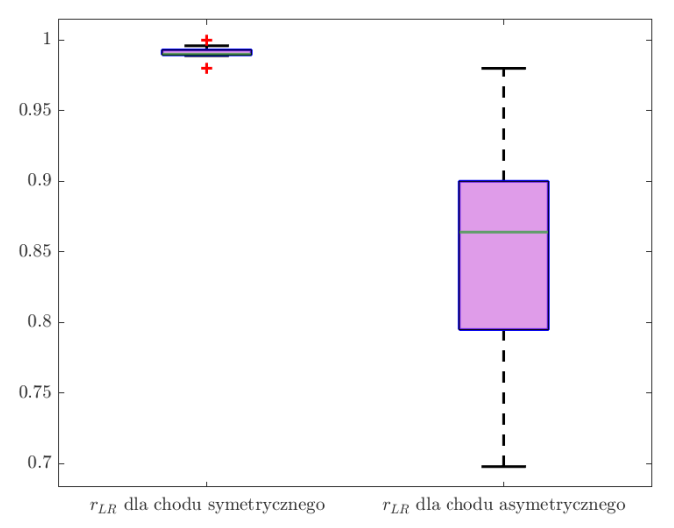
The goal of this thesis was to implement and examine a selected method of gait asymmetry assessment based on data collected from Microsoft Kinect v2 depth sensor. The scope of study also included the development of an application with a graphical user interface that facilitates gait analysis.
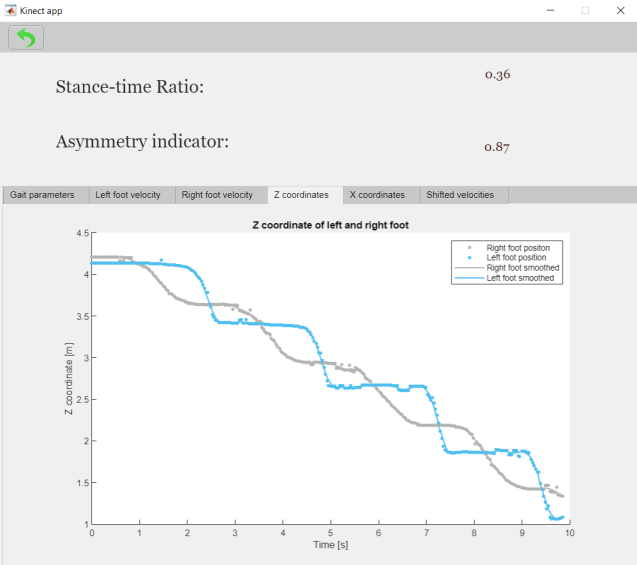
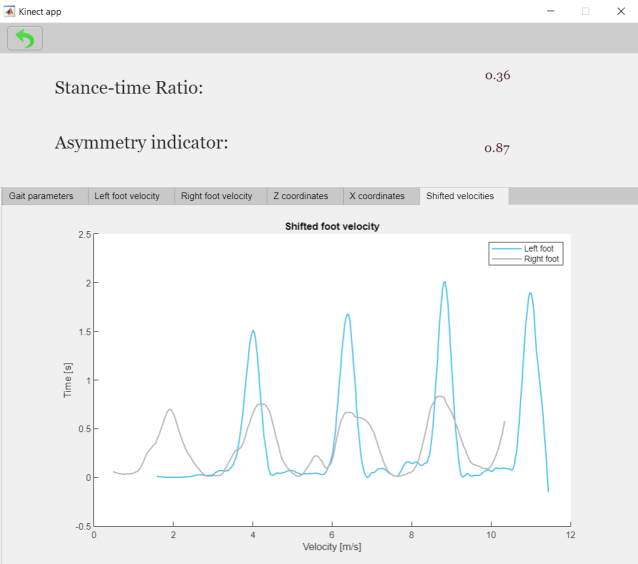
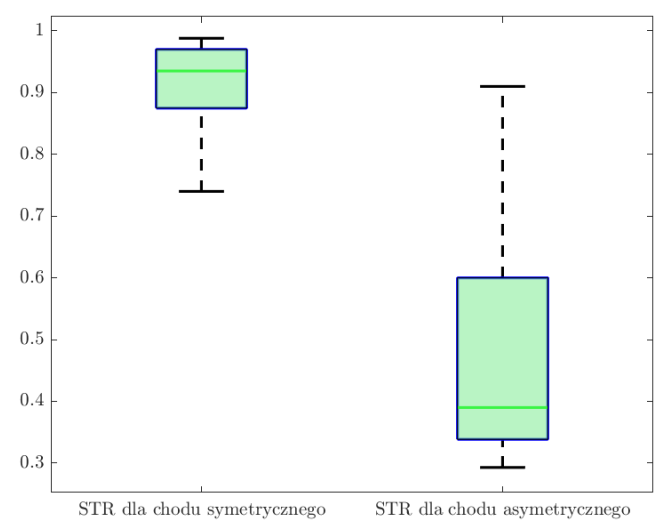
As a part of the thesis, an algorithm for calculation of the examined gait asymmetry indicator and the reference indicator was developed. That algorithm calculates those indicators using estimates of feet position and stance phase duration for right and left foot. The algorithm involves the following operations. In the beginning data received from the depth sensor are denoised along Z and X axis. Next stage consists of calculation of feet absolute velocity using the central-difference formula. The following step involves the calculation of maximum value of the correlation between the velocities of two feet, shifted in time. This correlation represents the examined gait asymmetry indicator. For the calculation of the reference indicator (stance-time-ratio), the average durations of stance phase for both feet were calculated. The calculation was made through comparison of instantaneous speeds of feet with dynamically matched threshold, aimed at determining the foot-contact and foot-off moments. On the basis of the determined time moments, following gait parameters are calculated: duration of gait phase, duration of gait cycle.
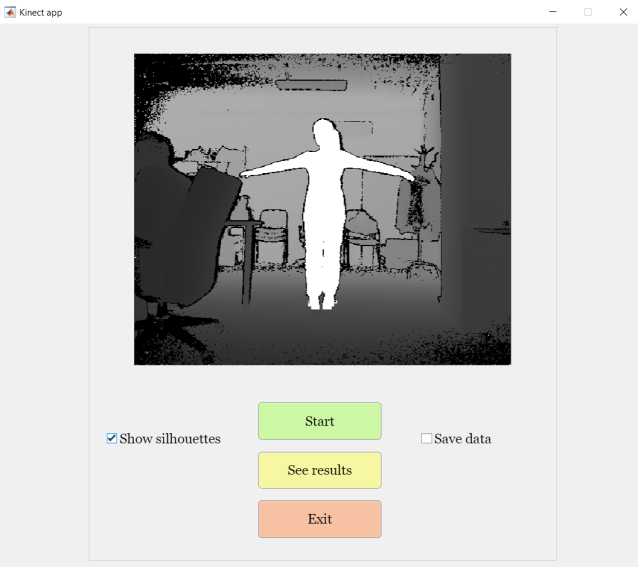
Both the algorithm and the application with a graphical user interface have been implemented in the MATLAB 2020b environment. Implemented application supports the gait analysis and enables the communication between the user and the depth sensor. The application calculates asymmetry indicators and chosen spatiotemporal parameters. It is capable of displaying numerical values of the results of gait analysis and figures which help to better understand those of analysis results.